This article is intended for: users with access to the Dashboard in Operational Budgeting.
Use this article when: you need visualizations and a high-level overview of the Operational Budget.
Within the operational budget that has been created, you have the ability to utilize the Dashboard.
The Dashboard tab shows the overall “big picture” of the biennial or annual operational budgeting values. The dashboard outlines the overall Expenditures, Revenues, and Surplus/Deficit values for the in-progress version statistics from each fund’s default budget.
Charts and Exporting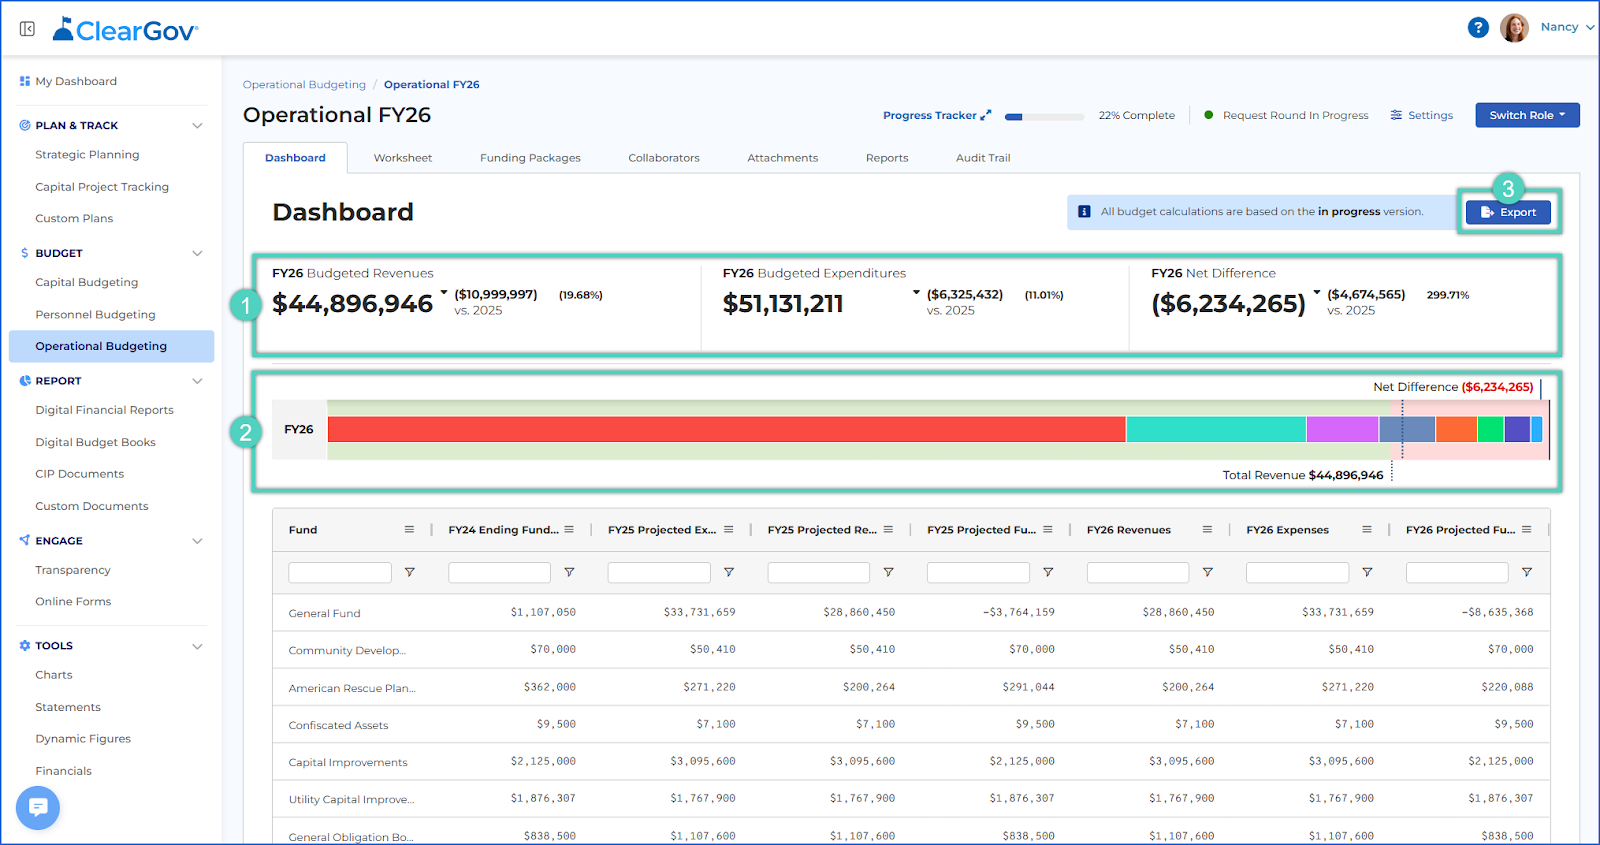
- The Metrics display will show budgeted revenues and expenditures and the net difference.
Note: Biennial budgeting will display the two budgeted years that were decided on when creating the budget.
-
Budgeted Revenues
Displays the total dollar amount from the In Progress column of the Worksheet’s Revenue section.
Shows dollar and percent change vs. the previous year for comparison purposes.
-
Budgeted Expenditures
- Displays the total dollar amount from the In Progress column of the Worksheet’s Expenditures section.
- Shows dollar and percent change vs. the previous year for comparison purposes.
-
Net Difference
- Displays the difference between budgeted Revenues and Expenditures.
- Shows dollar and percent change vs. the previous year for comparison purposes.
-
The Metric Bars will display the portion of each fund's revenue and the net difference between revenues and expenditures.
- Note: Hover over different portions of the metric bar to display revenue for a fund.
- Select the Export button to download the dashboard report to Excel, CSV, or PDF.
The Metrics Table
When you create an operational budget the system will take the fund balance information for two fiscal years earlier and populate the beginning balance. If this value does not exist in the ClearGov fund balances application the beginning balance will be set to $0, but users can modify this at any time. The metrics table will then use the net difference from the budget table to project an ending balance for the current year or biennial year.
Note: To add beginning fund balances view the Training & Support article: Updating Fund Balance Data.
The metric table is sortable on all columns.
- Type in the fund name or values to search for specific funds or values.
- Sort by selecting the title header. For example, selecting Revenue in the table header will allow the user to sort numerically by Revenue values. Selecting the table header a second time will change the sort to reverse alphabetical order. Selecting the table header a third time will remove the sort.
- Select the filter icon to sort for funds or values.
Have more questions or need assistance?
Submit a Request